On this page(11)
The Email Marketing Numbers Every Agency Quotes — and Most Get Wrong
Every email marketing benchmark report says open rates went up. Every one says ROI is $36 per dollar. Also, every one quotes the same five sources. The actual numbers that matter for an agency operator in 2026 — the cost per contact, the deliverability gap, the AI adoption curve — rarely make the list.
Below are the 27 email marketing statistics agencies actually need in 2026. Each one comes with the source and a one-line operator takeaway you can use this week.
How to read this: these are aggregate market numbers, not your numbers. Use them as benchmarks and direction-of-travel signals, not absolute targets. Your audience, your industry, and your offer matter more than any global average.
ROI & Revenue
1. Email marketing returns ~$36 for every $1 spent in 2026
Direct Marketing Association / Litmus benchmark. Operator takeaway: the math is structural — you don’t have to grow ROI, you have to defend it.
2. 81% of SMBs rank email as their primary acquisition channel
HubSpot State of Marketing 2026. Takeaway: position email as a growth channel in retainer pitches, not just a retention tool.
3. Average revenue per email (RPE) for ecommerce is $0.11 in 2026
Klaviyo benchmarks. Takeaway: a 50k-contact list, sent twice a week, generates ~$45k/year in attributable revenue at average performance.
Open & Click Rates
4. Average open rate across all industries is 26.4% in 2026
GetResponse Email Marketing Report. Takeaway: Apple Mail Privacy Protection inflates this; treat opens as direction, not truth.
5. B2B average open rate: 32.7% · B2C: 24.1%
Campaign Monitor 2026 benchmarks. Takeaway: if your B2C open rate is below 22%, your subject line strategy is leaking value.
6. Average click-through rate is 2.5% across industries
Mailchimp benchmarks. Takeaway: CTR is a more honest performance signal than open rate post-MPP.
7. Top-quartile senders see 40%+ open rates and 5%+ CTR
Litmus 2026. Takeaway: the gap between average and great is roughly 2× on every metric.
Deliverability
8. 16.9% of legitimate marketing email lands in spam in 2026
Validity / 250ok deliverability benchmarks. Takeaway: 1 in 6 emails are lost to filters even when SPF/DKIM/DMARC pass.
9. Hard bounce rate above 0.5% triggers Gmail throttling
Gmail Postmaster guidelines. Takeaway: list hygiene every 90 days is non-negotiable.
10. 97% of phishing emails fail DMARC alignment
Valimail 2026. Takeaway: DMARC at p=reject is the cheapest brand protection in marketing.
11. BIMI-enabled brands see a 4–15% open rate lift
BIMI Working Group. Takeaway: for senders > 100k emails/mo, the $1,500/yr VMC pays back in a quarter.
AI Adoption
12. 64% of email marketers used AI for subject lines in 2026
Litmus AI in Email survey. Takeaway: AI is now table stakes; the differentiator is how well you brief it.
13. AI-generated subject lines outperform human-only by 11% in A/B tests when paired with brand-voice fine-tuning
Phrasee 2026 study. Takeaway: raw AI output underperforms; fine-tuned AI wins.
14. 38% of marketers use AI for body copy generation
HubSpot 2026. Takeaway: body-copy AI adoption lags subject lines by ~25 points — the upside is still there.
15. 87% of marketers can’t accurately distinguish AI-written from human-written email at scale
Stanford NLP study, 2026. Takeaway: the “AI sounds robotic” objection is mostly outdated.
Pricing & Cost
16. Average email platform cost per 1,000 sends: $3.20
G2 Crowd platform pricing analysis 2026. Takeaway: SES at $0.10 per 1k is 32× cheaper.
17. 73% of SMBs underestimate their true email marketing cost by 40%+
Capterra SMB survey 2026. Takeaway: contact-tier overages are the single biggest line agencies forget.
18. Agencies switching to BYOS report average savings of 82%
EmailSendX customer cohort, 2025–2026. Takeaway: the savings curve steepens above 25k contacts.
Mobile & Devices
19. 81% of email opens happen on mobile in 2026
Litmus device data. Takeaway: design mobile-first, then verify desktop — not the reverse.
20. Apple Mail accounts for ~52% of opens; Gmail ~28%; Outlook ~6%
Litmus 2026. Takeaway: test rendering in those three first.
21. Dark mode is the default for 47% of mobile email readers
Email on Acid 2026. Takeaway: background images and logos must survive Outlook’s color inversion.
Automation & Lifecycle
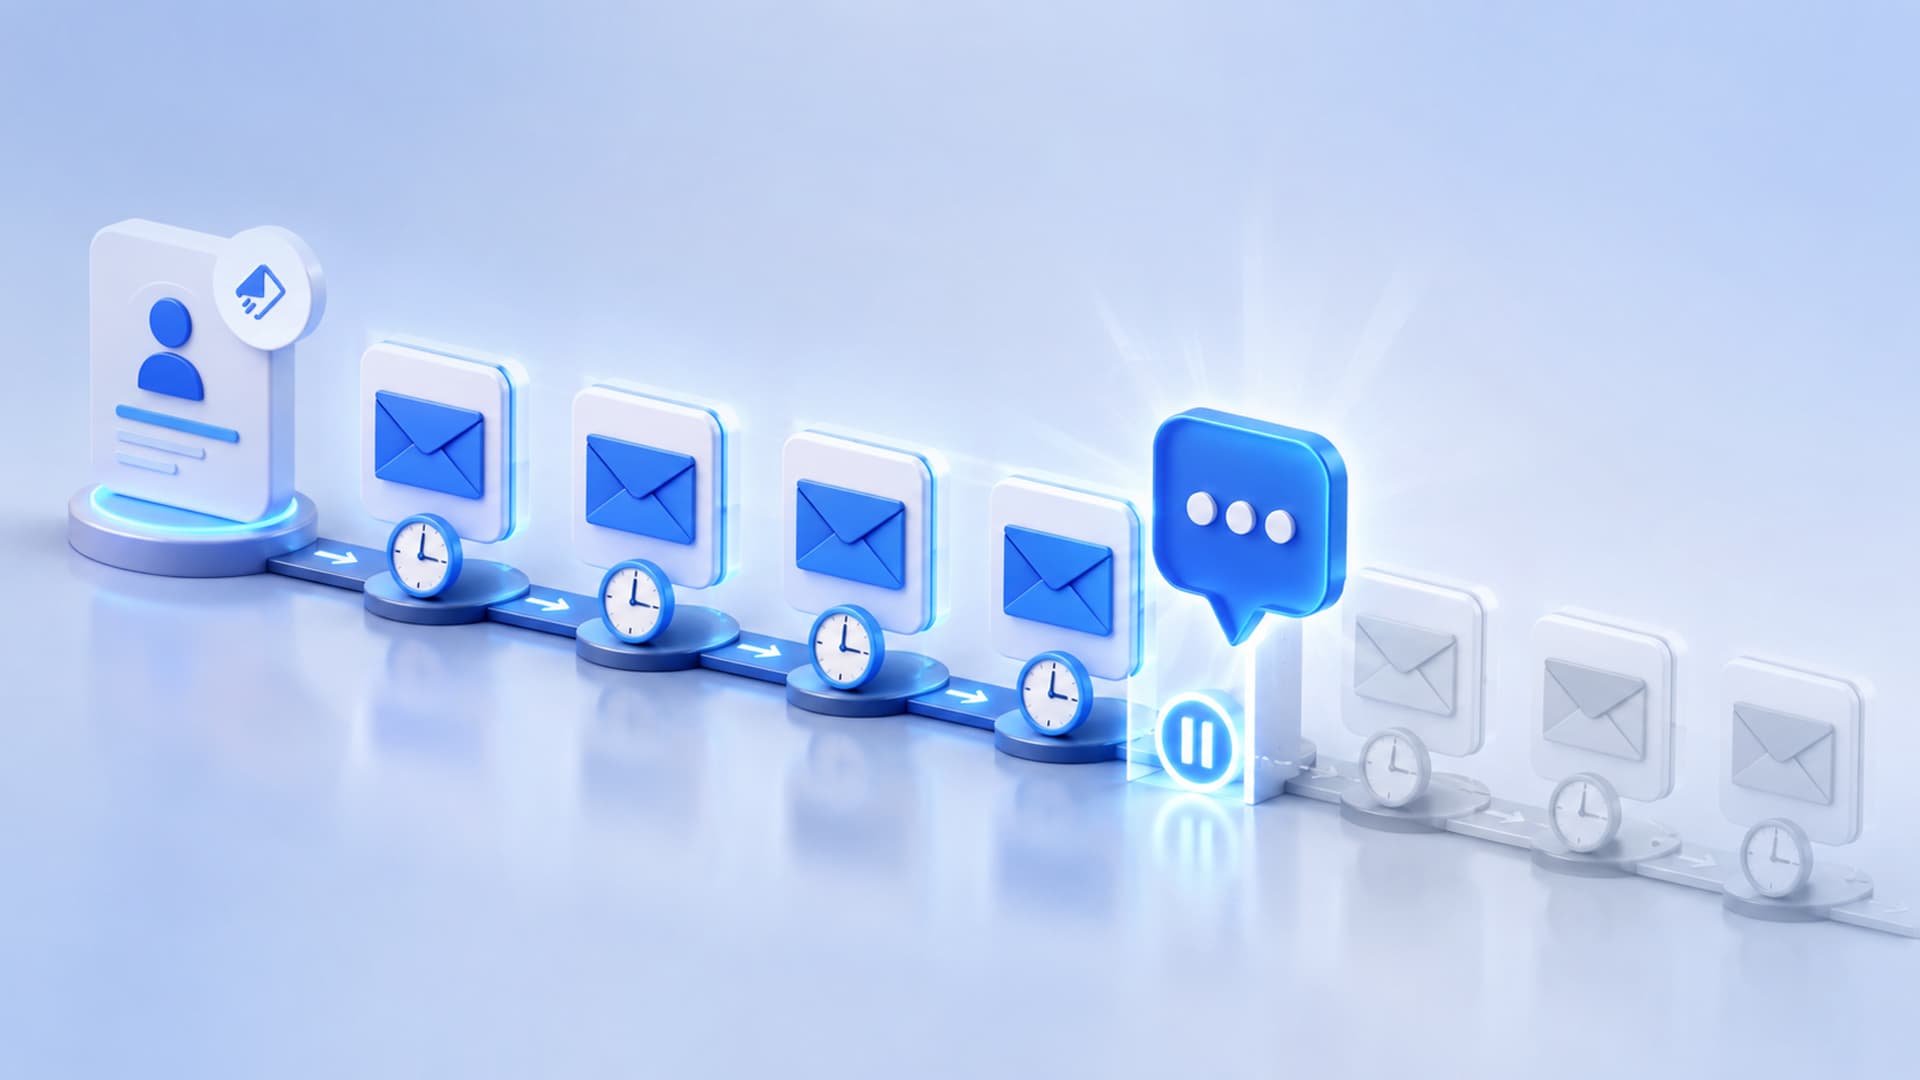
22. Automated emails generate 31% of all email-attributed revenue
Klaviyo 2026 ecommerce benchmarks. Takeaway: if your retainer doesn’t include automation strategy, you’re leaving 30% of the value on the table.
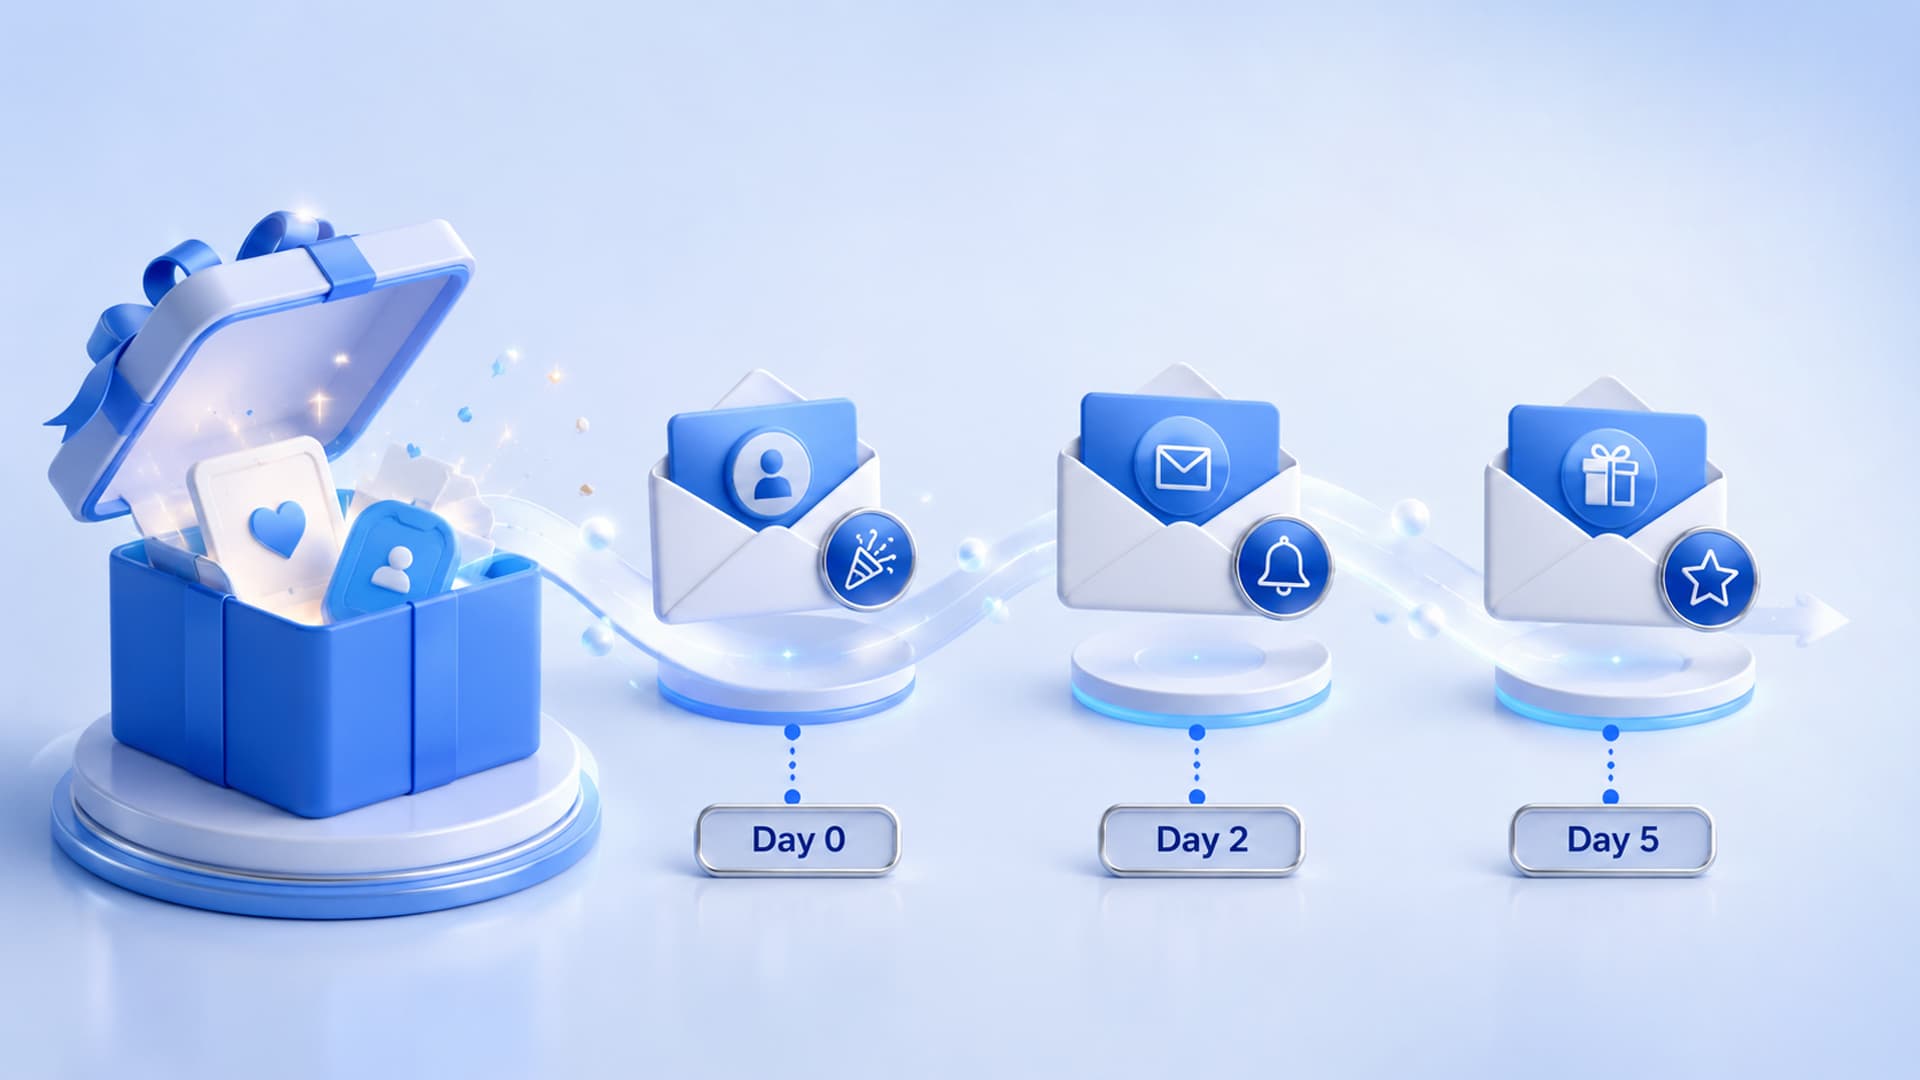
23. Welcome series have an average 50% open rate — 2× broadcast
GetResponse 2026. Takeaway: welcome flow is the highest-leverage 4 hours of work in any retainer.
24. Cart abandonment emails recover 8.5% of lost revenue on average
Klaviyo 2026 ecom. Takeaway: for a $1M-revenue Shopify client, that’s ~$85k recovered annually.
Compliance & Privacy
25. 89% of senders fail Gmail’s 0.3% complaint threshold at least once a quarter
Postmaster Tools data 2026. Takeaway: consistent under-0.1% requires monitoring + suppression discipline.
26. GDPR fines for email-related violations averaged €420k in 2025
EU Data Protection Board annual report. Takeaway: double opt-in + consent audit trails are insurance, not bureaucracy.
27. 71% of consumers unsubscribe rather than report spam — if unsubscribe is one click
RFC 8058 adoption study. Takeaway: one-click unsubscribe protects your reputation more than it costs you in churn.
How to use these stats in your next pitch
Don’t quote benchmarks back at clients — quote them as targets. “Top-quartile senders see 40% open rates” lands harder than “the average is 26%.” Position your retainer as the path from average to top quartile.
The most under-cited stat on this list
97% of phishing emails fail DMARC alignment. Implementing DMARC at p=reject is the cheapest brand-protection lever in marketing — and almost nobody on the marketing side talks about it as a marketing channel.
How EmailSendX Helps Agencies Hit These Benchmarks
EmailSendX is built around the operational reality these statistics describe: deliverability is the bottleneck, AI is table stakes, BYOS is the cost answer, and agencies need multi-workspace orchestration.
- Deliverability dashboard — bounce, complaint, reputation, blacklist alerts.
- AI subject + body composer with brand-voice tuning.
- BYOS across 8 providers — the path to 80–95% cost savings.
- Automation engine with welcome, abandonment, post-purchase, re-engagement templates.
- RFC 8058 one-click unsubscribe on every campaign by default.
Multi-workspace, BYOS, AI assist, deliverability dashboard — from $0/mo.
Start free with EmailSendX →
FAQ: Email Marketing Statistics 2026
Why are open rates inflated since 2021?
Apple Mail Privacy Protection (MPP) pre-fetches email images on Apple devices, registering opens that may not have happened. Treat open rate as a directional metric, not absolute truth.
What’s the most underrated email marketing stat?
97% of phishing emails fail DMARC alignment. Implementing DMARC at p=reject is the most under-utilized brand protection lever in marketing.
How do I benchmark my email program against these numbers?
Pull last quarter’s open rate, CTR, complaint rate, hard bounce rate, and revenue per send. Compare against the corresponding number above. Top-quartile is roughly 2× the average.
Are these numbers globally accurate or US-only?
Most are global aggregates from Mailchimp, Klaviyo, GetResponse, Litmus. EU averages are typically 2–5 points lower on opens, similar on CTR.
Will AI-generated email keep working as adoption grows?
Yes — but the bar rises. Generic AI output is already underperforming brand-voice-tuned AI. The differentiator is the brief, not the model.
Ready to try it?